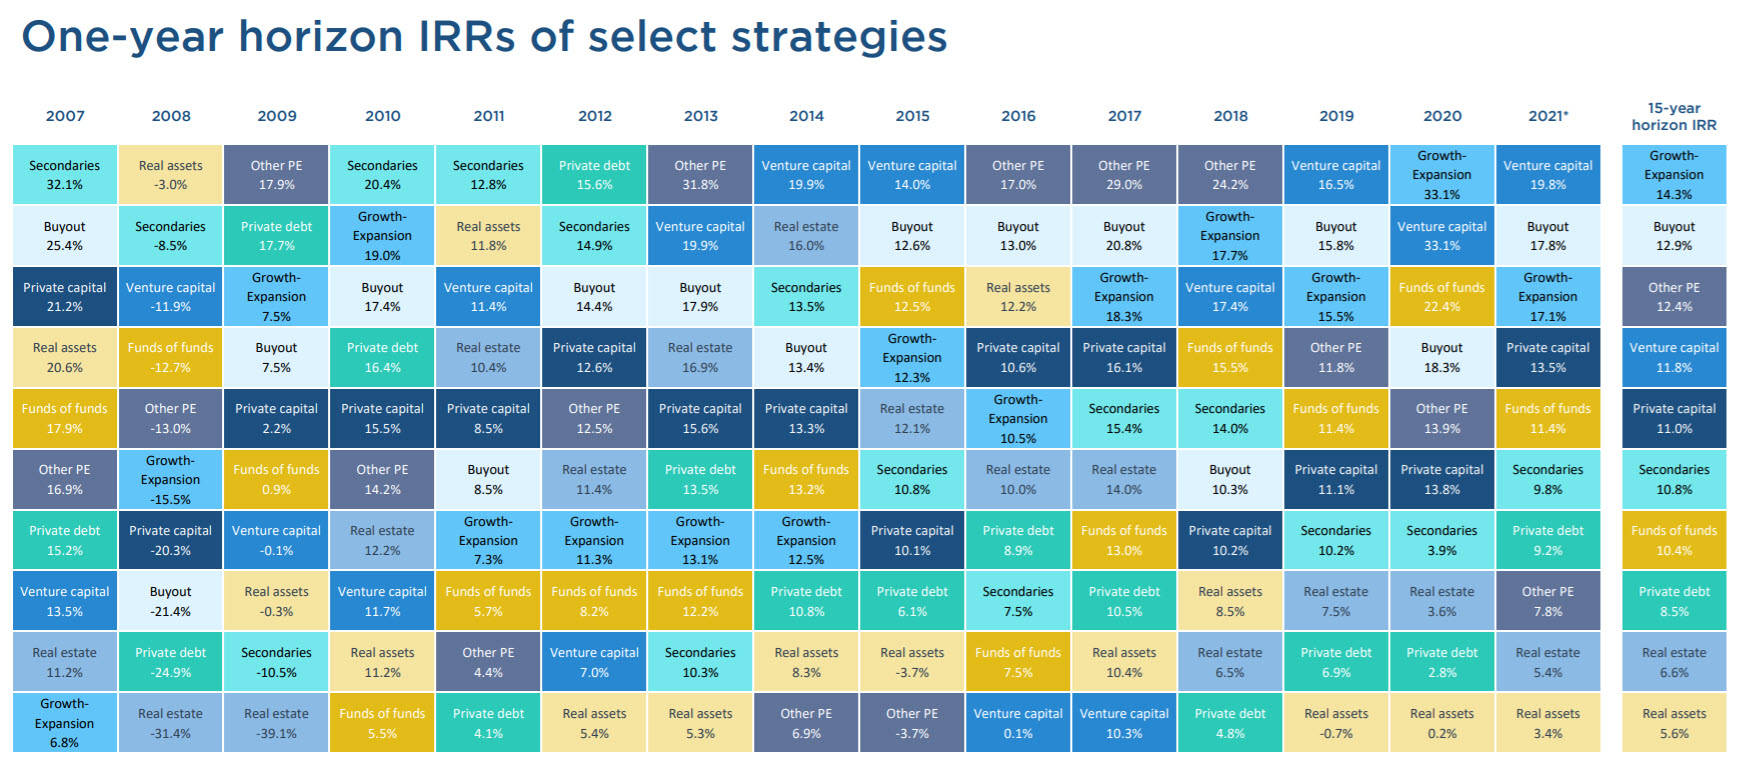
Buyout and growth funds came in second and third—at 17.8% and 17.1%, respectively—before a noticeable drop-off in the results from other strategies.
The trend of VC and private equity standing out in terms of performance has persisted for several years now (see the quilt chart below). This has gained increasing attention across the broader financial landscape as many of America’s largest university endowments have recently reported astronomical gains, boosted heavily by allocations to alternative assets.

Looking ahead, PitchBook’s preliminary returns data for Q2 2021 also shows venture capital ranked first among private strategies, followed by funds-of-funds, secondaries and debt.
“For the past year, the record-setting VC and PE dealmaking and exit environment has led to a torrid pace of value creation, both realized and on paper,” said Zane Carmean, a quantitative research analyst at PitchBook. “We’ll be keeping a close eye on a potential mean regression caused by COVID variants, inflation, the jobs market and other macroeconomic risks.”
On the other end of the Q1 2021 performance spectrum were real estate and real assets, with respective IRRs of 5.4% and 3.4%.
Private real estate funds have no doubt had a difficult few years, and pandemic-driven uncertainty contributed to the strategy’s dry powder levels declining in 2020 for the first time in almost a decade.
With real assets, it’s a narrative with mixed storylines. Infrastructure has remained fairly steady and could get a boost if President Biden’s infrastructure plan passes. While the recent fortunes for oil and gas investors have been far worse—though the trend turned more positive in the back half of 2020 and first quarter of 2021.
“Rising energy commodity markets and subdued capital expenditure for supply expansion are possible tailwinds to watch in the traditional energy space,” Carmean said.
Related research
PitchBook Benchmarks provide a one-stop destination that tracks aggregate fund performance across a range of strategies by measuring cash multiples, IRR and other metrics.
The latest reports, featuring data through Q1 2021, are available here. You can access separate editions across the following fund types and geographies:
- Global
- North America
- Europe
- Venture Capital
- Private Equity
- Funds-of-funds
- Secondaries
Are you curious about how closely private fund strategies like PE and VC are correlated when it comes to performance?
To see a correlation matrix based on the quarterly returns of each asset class from Q1 2006 to Q1 2021, be sure to check out the debut edition of our Quantitative Perspective: US Market Insights.
It’s one of many insights from the new report series that features nearly 70 pages of data and 75 charts, offering a bird’s-eye view of alternative markets and illuminating key trends across a range of investment strategies.
Featured image by bloodua/Getty Images
Credit: Source link


